
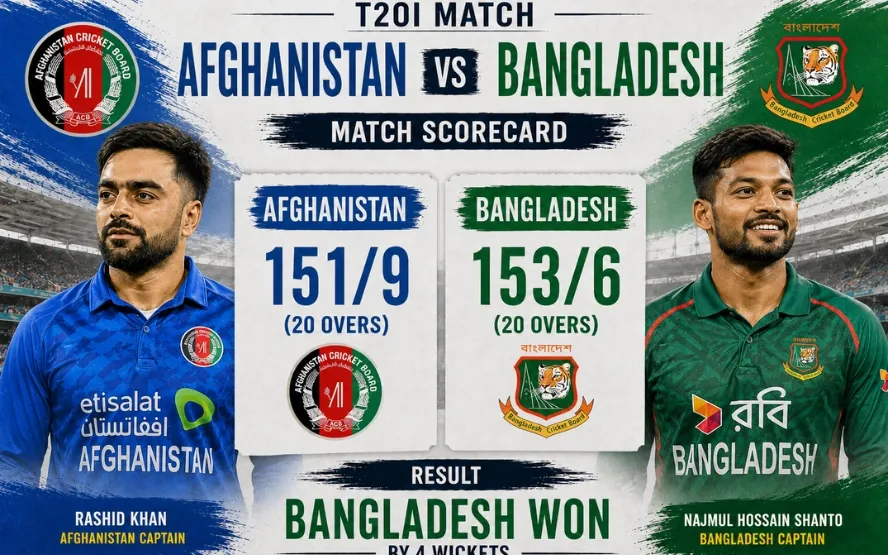
A cricket scorecard gives readers a quick way to understand what happened during a match without watching every delivery. On cricketmatchteam.com, cricket followers can explore scorecard details and learn how runs, wickets, overs, and individual performances explain the match situation. At first, the numbers may look confusing, especially when a game includes several innings, partnerships, extras, and bowling figures. Once these details become familiar, following a match becomes much easier. A scorecard does more than display the final total because it also shows how that total developed. Readers can identify important contributions, understand sudden changes, and see why one team gained an advantage. Learning to read these details properly makes cricket coverage more useful for casual viewers and regular followers alike.
Understand The Basic Scorecard
A cricket scorecard usually begins with the teams, innings totals, wickets lost, and overs completed. The main score is often written as runs followed by wickets, such as 156/4, meaning the batting team scored 156 runs and lost four wickets. Overs indicate how many six-ball overs have been completed, although the displayed format can require careful reading. For example, 17.3 overs means seventeen complete overs plus three additional legal deliveries. It does not mean seventeen and three-tenths overs in ordinary decimal notation. This difference matters when calculating the remaining deliveries or understanding the current scoring rate. Scorecards also show whether an innings has finished, remains in progress, or ended because the batting side was dismissed or reached its target. These basic details provide the starting point for understanding almost every cricket match.
Read Runs And Wickets
Runs show how many points a batting team has accumulated, while wickets indicate how many batters have been dismissed. Both numbers matter because a large total does not always mean the batting side has complete control. A team scoring 180 runs with only three wickets lost may have a stronger position than another team reaching 180 with eight wickets down. The second side has fewer established batters available and may struggle to increase its score. Scorecards list individual batters alongside their runs, balls faced, boundaries, and sometimes their strike rates. These figures help explain how the innings developed rather than showing only the combined total. A batter scoring 65 from 40 balls has contributed differently from someone scoring 65 from 75 deliveries. Understanding this distinction makes individual performances easier to evaluate.
Understand Bowling Figures
Bowling figures explain how much work each bowler completed and what results followed. A typical line may display overs bowled, maidens, runs conceded, and wickets taken. If a bowler finishes with figures of 4/28, that usually means four wickets were taken while conceding 28 runs, although scorecard layouts can vary between platforms. Economy rate indicates the average number of runs conceded per over. A lower economy rate can suggest that a bowler restricted scoring, but the match situation still matters. Taking two wickets during a difficult chase may be more influential than collecting wickets after the batting side has already secured a comfortable total. Readers should also consider the number of overs bowled and the conditions during that innings. Bowling statistics become more meaningful when compared with the other bowlers’ performances and the pressure faced by the batting team.
Calculate The Scoring Rate
The run rate describes how quickly a batting side scores during its innings. It is calculated by dividing the runs scored by the number of overs faced, using the actual number of completed deliveries when necessary. For example, a team scoring 90 runs in fifteen complete overs has a run rate of six runs per over. In limited-overs cricket, this number helps readers understand whether a team is progressing quickly enough for its intended target. A high run rate can indicate aggressive batting, although it may also involve greater risk of losing wickets. In a successful chase, the required run rate shows how quickly the batting side must score from that point onward. If 60 runs are needed from six overs, the required rate is ten runs per over. Comparing current and required rates provides a clearer picture of the pressure during a match.
Notice Partnerships And Extras
Partnerships explain how two batters combine their efforts before one of them is dismissed or the innings ends. A strong partnership can stabilize an innings after early wickets or help a team accelerate toward a competitive total. Scorecards may show partnership runs and the number of deliveries faced, allowing readers to see how quickly the pair scored together. Extras are another important detail because not every run comes directly from a batter’s shot. Wides, no-balls, byes, and leg-byes can add runs to the team’s total under different circumstances. These runs can become especially important during close matches where a few additional runs change the result. Extras also help explain why the team total may not equal the sum of individual batter scores. Checking partnerships and extras gives readers a fuller understanding of how the final score was built.
Compare Different Match Formats
Cricket scorecards vary according to the format being played, so readers should consider whether the match is a Test, One Day International, or Twenty20 fixture. Test cricket can involve two innings per team and may continue across several days, making wickets, partnerships, and lead calculations particularly important. One Day International matches generally provide each side with a limited number of overs, commonly fifty, unless conditions or match rules change that allowance. Twenty20 cricket normally limits each team to twenty overs, which places greater emphasis on scoring speed and efficient use of deliveries. A total of 160 runs might be competitive in one situation but insufficient in another, depending on the pitch, weather, and opposition. Comparing scores without considering the format can therefore produce misleading conclusions. The match context helps explain whether a team’s performance was strong, average, or disappointing.
Follow The Match Situation
A scorecard becomes more informative when readers connect its numbers with the current match situation. During a chase, the target, remaining wickets, overs left, and required run rate help explain which side faces greater pressure. In a first innings, the number of wickets remaining and the scoring rate can indicate whether the batting team has opportunities to build a larger total. Individual figures should also be viewed alongside the stage of the match. A quick fifty during the final overs may have a different effect from a patient fifty that steadies an early collapse. Weather interruptions, revised targets, and changing pitch conditions can also affect how a score should be interpreted. Rather than judging a performance from one statistic, consider several details together. This approach helps readers understand why a team is ahead or behind instead of simply reacting to the displayed numbers.
Conclusion
Reading a cricket scorecard becomes easier when runs, wickets, overs, bowling figures, partnerships, and scoring rates are understood together. These details explain not only the final result but also the decisions and performances that shaped the contest. Readers visiting cricketmatchteam.com can use this knowledge to follow cricket scorecards more confidently and understand match progress with greater clarity. Start by checking the innings total and wickets, then examine individual contributions and the remaining match situation. With regular practice, even complicated scorecards become easier to interpret. A few carefully understood numbers can reveal much more about a cricket match than the final score alone.
Read also :-